Solar conditions
Solar-Terrestrial data
The Solar Widget is based on data from the United States National Oceanic and Atmospheric Administration (NOAA). The raw data is publicly available -in text format- here.
To make any sense of the raw data takes some computational power. After a some trial-and-error and experimenting I came up with an algorithm that I feel represents the HF propagation conditions quite well. So now is the time to go public with my widget.
Solar widget
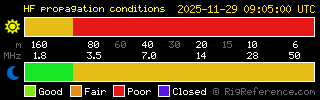
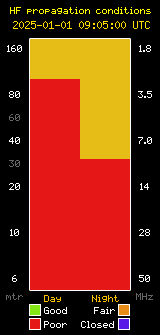
The RigReference Solar Widget gives an indication of the conditions on the various ham bands, for both day and night time.
How to use...
Incorporating the solar widget in your own site requires you copy-paste the code below into your own page -at the location where you want the widget to be displayed.
| Preview | Javascript code | Plain HTML code |
|---|---|---|
| Wide format | ||
|
|
|
| Tall format | ||
|
|
|
|
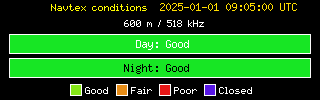
Navtex band, 600 meter / 518 kHz Custom made for www.navtex.net |
||
 |
|
|
|
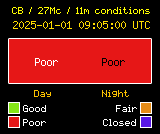
CB / 11 meter band |
||
|
|
|
Current HF-conditions 2026-04-26 21:00:02 UTC
Depending on where you are located on earth, either day or night conditions may be relevant for you.
Conditions are estimated based on the latest NOAA data and updated every hour. Note that NOAA does not provide fresh data for all parameters every hour. Some parameters refresh at different intervals (3 or 8 hours).
| Geomagnetic Storms | G0 None |
| Radio Blackouts | R1 Minor |
| Geomagnetic Storms | G1 Minor |
| Radio Blackouts | R2 Moderate |
| Band | Day | Night |
|---|---|---|
| 600 meter | Good (85) | Good (81) |
| 160 meter | Good (81) | Fair (78) |
| 80 meter | Fair (79) | Fair (76) |
| 40 meter | Fair (77) | Fair (74) |
| 20 meter | Fair (74) | Fair (73) |
| 10 meter | Fair (63) | Fair (61) |
| 6 meter | Poor (44) | Poor (38) |
Latest measurement - raw data
This is the latest measurement from NOAA. I use these values to estimate current propagation conditions.
| Parameter | Value | Remarks |
|---|---|---|
| Time | 2026-04-26 21:00:02 UTC | Time of measurement |
| Ai | 9 | A-index |
| Ki | 1 | Planetary K-index |
| SFi | 156 | Solar Flux index |
| Proton flux | 21.759811401367 | |
| Electron flux | 212.39038085938 | |
| X-Ray | C4.2 | |
| Geomagnetic Storm (G-scale) | G0 | None — NOAA Space Weather Scale |
| Radio Blackout (R-scale) | R1 | Minor — NOAA Space Weather Scale |
| Forecast: Geomagnetic | G1 | Predicted for next 24 hours |
| Forecast: Radio Blackout | R2 | Predicted for next 24 hours |
| Calculated conditions | ||
| Signal/Noise level | S0-1 | Background S/N level |
| Geomagnetic field | Very quiet | Ranges from Very quiet to Storm |
| MUF | 30 MHz | Maximum Usable Frequency |
Historic data
Solar activity as recorded by NOAA of the past 7 days. Solar flares can be seen especially in the K-index graph as large spikes. Shortwave propagation can be severely affected by flares, causing higher noise levels and weaker signals.
Ai indicates a daily average level for geomagnetic activity. Values range from about 0 to 400. Ai is the average of eight 3-hour Ki values and provides a level of instability in the earth's geomagnetic field. Instability is greatest when both Ai and Ki are high. This can cause HF-signals to fade and paths to open and close with little warning. A high Ki and low Ai indicates an abrupt disturbance in the geomagnetic field, resulting in intense but brief disruptions in HF-propagation. Ai is recorded once a day.
Ki indicates the disturbance in the horizontal component of the earth's magnetic field. Values range from 0 to 9 and are based on 3-hour interval measurements in nT (nano Tesla). The higher the Ki-value, the more static and interference you can expect. Ki-values have more impact at higher latitudes (closer to the poles).
SFi (Solar Flux Index) is the solar radiation measured at 2800 MHz (10.7cm) and gives a good indication of the F-layer ionization. The higher the number, the more the ionization, which gives us nice DX openings on HF-bands. Higher bands are less affected by SFi. Measurements range from about 60 to 300 and are recorded 3 times per day. The up and down motion is caused by the rotation of the sun which has a cycle of 28 days.
How Propagation Conditions are Calculated
RigReference uses a sophisticated algorithm to calculate HF propagation conditions based on multiple solar-terrestrial parameters. The calculation considers different factors for day and night propagation, and weights them according to their impact on each band.
Parameters Used
| Parameter | Range | Interpretation | Impact on Propagation |
|---|---|---|---|
| Solar Flux Index (SFi) | 64-300+ |
64-70: Poor 70-120: Fair 120-200: Good to Excellent 200+: Extreme |
Higher SFi increases F-layer ionization. Essential for higher bands (10m, 6m). Affects Maximum Usable Frequency (MUF). |
| A-Index (Ai) | 0-400 |
0-20: Excellent 20-120: Minor to Moderate 120-200: Strong Storm 200+: Severe Storm |
Lower is better. High values indicate geomagnetic instability causing signal fading, especially on lower bands. |
| K-Index (Ki) | 0-9 |
0-2: Quiet 3-4: Active 5-6: Minor to Moderate Storm 7-9: Strong to Extreme Storm |
Lower is better. High values cause increased noise and signal disruption. Most severe at higher latitudes. |
| X-Ray Level | A0.0-X9.9+ |
A, B: No impact C: Minor absorption M: Moderate absorption X: Severe blackout |
Affects D-layer absorption during daytime only. Higher classes cause radio blackouts, especially on lower frequencies. |
| Proton Flux | 0.1-1,000,000+ |
<10: Normal 10-1,000: Minor to Moderate 1,000-100,000: Strong to Severe 100,000+: Extreme |
High values cause polar HF blackouts and degraded propagation. Measured on logarithmic scale. |
| Electron Flux | 0.1-10,000+ |
<100: Normal 100-1,000: Active 1,000+: Alert |
High values indicate potential for polar HF disruption and increased D-layer absorption. |
| Bz Component | -50 to +50 nT |
Positive: Favorable 0 to -20: Active -20 to -50: Storm |
Negative values weaken Earth's magnetic field, allowing more solar particles to penetrate, increasing geomagnetic disturbance. |
| Solar Wind Speed | 200-1000+ km/s |
200-400: Normal 400-600: Active 600-800+: Storm |
Higher speeds increase pressure on ionosphere, causing geomagnetic disturbances and auroral activity. |
| G-Scale (Geomagnetic Storms) | G0-G5 |
G0: None G1-G2: Minor to Moderate G3-G5: Strong to Extreme |
NOAA's official geomagnetic storm scale. Higher G values indicate stronger geomagnetic disturbances, causing signal fading and path disruption, especially on lower HF bands and at higher latitudes. |
| R-Scale (Radio Blackouts) | R0-R5 |
R0: None R1-R2: Minor to Moderate R3-R5: Strong to Extreme |
NOAA's official radio blackout scale. Higher R values indicate stronger HF radio blackouts caused by X-ray flares. Most severe on lower frequencies and on the sunlit side of Earth. |
| 24-Hour Forecast (G & R) | G0-G5 / R0-R5 |
Same as above: None Minor to Moderate Strong to Extreme |
NOAA's predicted storm levels for the next 24 hours. Used to adjust current condition scores: if conditions are expected to worsen, scores are nudged down; if improving, scores are nudged up. |
Calculation Methodology
Day Time Propagation
The daytime score combines five weighted factors:
- MUF Factor (30%) - Determines if the frequency is below, near, or above the Maximum Usable Frequency based on SFi
- Ionization (25%) - Combination of SFi, X-ray, and Proton flux. Higher bands require more ionization
- Geomagnetic Stability (20%) - Based on G-scale, K-index, A-index, Bz, and Solar Wind. Lower bands are more affected
- D-layer Absorption (15%) - Based on R-scale, X-rays, Proton and Electron flux. Most severe on lower frequencies
- Forecast Trend (10%) - Adjusts score based on NOAA's predicted G-scale and R-scale for the next 24 hours
Night Time Propagation
The nighttime score adjusts for the absence of sunlight:
- MUF Factor (35%) - Even more critical at night when ionization is reduced
- Ionization (30%) - Only SFi and Proton flux (no X-rays). Overall ionization reduced by 30%
- Geomagnetic Stability (25%) - Based on G-scale, K-index, A-index, Bz, and Solar Wind. More important due to weaker F-layer
- Forecast Trend (10%) - Adjusts score based on NOAA's predicted G-scale for the next 24 hours
- D-layer Absorption (0%) - No D-layer at night, no absorption
Band-Specific Considerations
| Band Characteristic | Lower Bands (160m-40m) | Mid Bands (30m-15m) | Higher Bands (10m-6m) |
|---|---|---|---|
| Geomagnetic Sensitivity | High - Very sensitive to K/A indices | Moderate sensitivity | Low - Less affected by storms |
| Ionization Requirements | Low - Open even with low SFi | Moderate SFi needed | High - Require high SFi (150+) |
| D-layer Absorption | High - Severe absorption during X-ray events | Moderate absorption | Low - Minimal absorption |
| MUF Dependency | Low - Almost always below MUF | Moderate - Near MUF in low solar activity | High - Often above MUF in low activity |
Note: This calculation is based on established scientific relationships documented by NOAA and N0NBH (Paul L. Herrman). The algorithm continuously evolves as we gain better understanding of solar-terrestrial interactions.
About
RigReference.com aims to become the most comprehensive reference guide for ham radio equipment. If you have any questions or suggestions, or if you'd like to participate, please get in touch.